Data Science Map
23 October, 2014
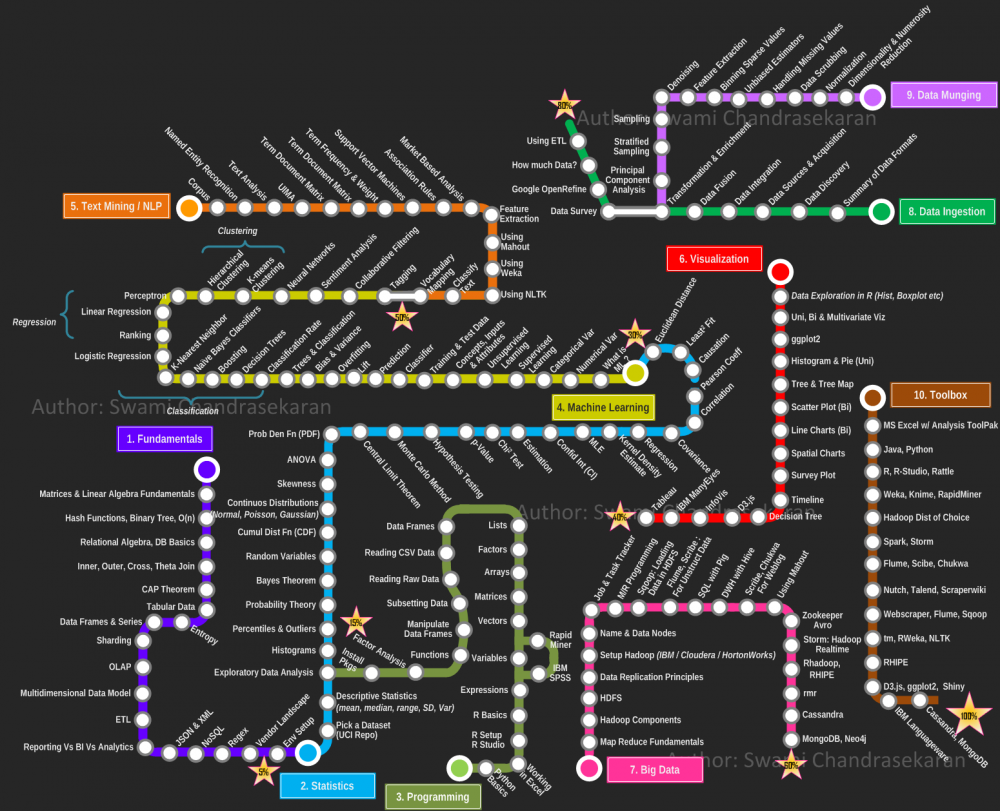
A nice data science map by Swami Chandrasekaran!
Living in London, working with a lot of data.
Email will at cubittsmith dot co dot uk

A nice data science map by Swami Chandrasekaran!
The natural way to visualise this data is as a tree diagram. Here I've extended the d3 tree by Rob Schmuecker to work with our csv data. You can expand and collapse the nodes, zoom in and out, and drag the canvas to pan around. Obviously, I've swapped real data for something more blog friendly...
For our use case, because we had a lot of nodes, we wanted to be able to search the org chart, displaying sub-trees depending on the result. We also needed to overlay information like location, role, grade and contact details in popups. For the full caboodle, also incorporating filters in angular.js, take a look at ubero's post, or go straight to his worked example!
I've been having a play with twitter sourced wordclouds this afternoon. Here's one I made with the search term 'Jeremy Clarkson':
Click permalink below to see a few more, and find out how I made them!
This weekend I've spent a little time playing with the mapping and transitions in D3, as I have an idea of somewhere I could use them on a project. Anyway, I've got as far as this tonight, which takes a csv of countries and values and displays different levels outflow from the UK, with a nice animation as it loads...
So in the example data here I have "France: 3, Russia: 6, South Africa: 2, Australia:10".
My Facebook friend network...
As you may have noticed if you know me, I've scrambled all the names on this graph to protect people's identities, because my girlfriend was understandably alarmed by having her affiliation with me available for all to see on the internet. Which is ironic when you consider Facebook in general.
Click permalink to read more...
As part of a recent project, I discovered the Sankey diagram implementation in D3. As it happened this graph perfectly fulfilled one of project objectives, which was the visualise the flow of candidates through a system. Here's an example:
Click permalink to read more...
I tend to make SQL server the workhorse of most projects. Obviously it's a powerful tool, but it also works great as a central data store, on the basis that any tools worth their salt (e.g. python, R, octave, qlikvew, tableau etc etc) have mature odbc connectors that allow me to connect in, do work, and possibly deliver the results back to SQL with little bother.
However, since making use of more bespoke visualisation tools like D3 and Sigma.js, which tend to use the JSON file format for their online data storage, I've found myself awkwardly crafting JSONs with a lot of string manipulation and 'for xml path' tricks in SQL.
Recently I decided to fix this once and for all by knocking up a quick SQL->JSON converter in python.
Click permalink to read more...
If this works, you should see a nice force directed graph below...