
Find outliers in a time series (or finding unusual behaviour)
Recently I've been having fun with time series decomposition, and in particular, finding outliers in a particular time series.
To use a potentially weak analogy, let's say we're running a website, and we're looking for occasions when our users don't log on when they normally would. This method will help identify such occasions so they can be scrutinised!
Click permalink below to read more
The approach originally proposed was to look for any users that log on every day in a two week window, except one. This would certainly imply that the one day they didn't log on was unusual. While this may highlight some unusual behavior, it clearly won't capture all cases, for instance:
- What about users that normally log on every Tuesday and no other days? We would have to write another test looking for these users, and then check for any Tuesdays they missed, or any non-Tuesdays they did log on.
- How about if a user normally logs on 10 times every weekday, but then one Wednesday only logs on once. They still logged on, just not as many times as normal.
One approach to capturing more cases would be to consider each user's visiting frequency for each day of the week. For instance, we can look at the distribution of visiting frequency by User_A on Mondays. Then we can look for any Mondays where User_A's visiting frequency falls more than two standard deviations below the mean for Mondays. Then repeat this for every user and every day of the week.
However, there is a problem with this approach; it is normal for user behavior to change over time. If we averaged over a whole year of visits, the mean visiting frequency for a particular user on a particular day may have changed in the year, leaving us with a wide or messy distribution, and making it difficult to spot outliers. One response to this would be to only consider N weeks of data at a time (a window). Then when trying to determine whether a particular day is an outlier, we compare it's visit frequency to the distribution of visits from the N weeks prior to that one.
This is beginning to sound quite involved, and if we are considering several year's worth of data, we have a lot of moving windows to script/program/query. Fortunately, this is a time series problem, and so instead, we can use the R time series library 'forecast', and in particular the stl function (Season Trend Decomposition Procedure based on Loess).
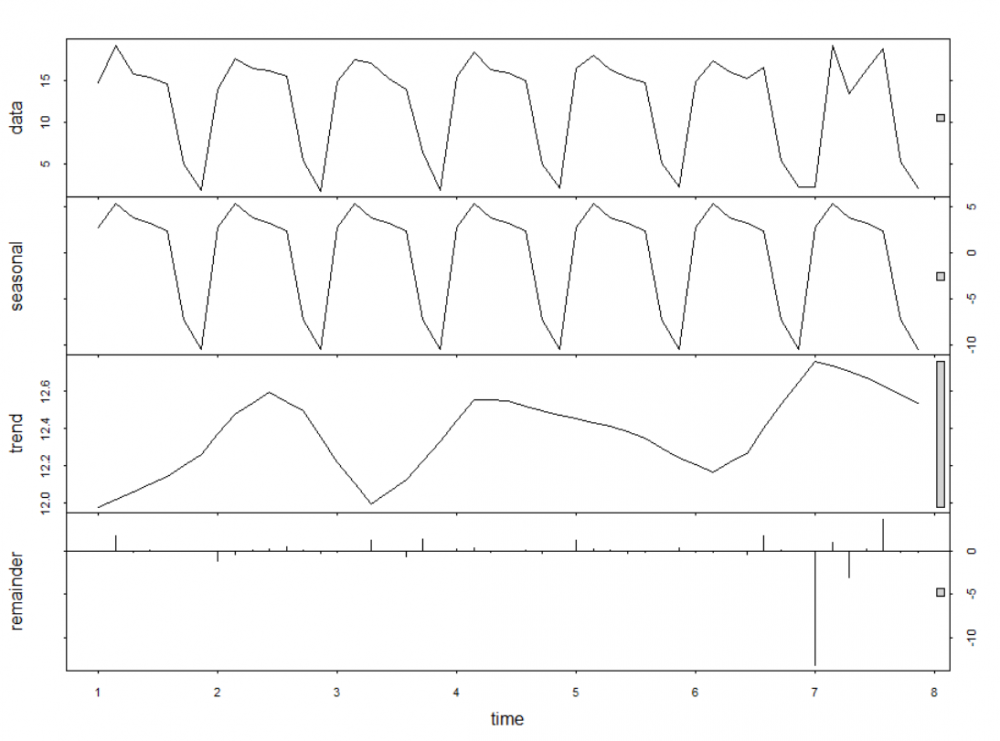
With this function, if we tell R the periodicity of the data we're looking at (in this case, weeks), it will break the series into three components:
- A seasonal part, (which repeats every period) - this will capture the users normal weekly visiting pattern. Critically, if we give stl the right settings, the seasonal pattern is free to change over time, reflecting legitimately changing user behavior.
- An underlying trend - this part is the underlying trend in usage for that user, and indicates whether they are visiting more or less over time.
- Error - when you add the seasonal and trend components, you get the model's prediction for the visit frequency for a particular day. The error is the difference between this prediction and the real value for that day.
The key part for us is the error component. Where a user is behaving very predictably, the fitted model will predict the user's behavior well, and so this error component will be generally small. Where a user is less predictable, the error will be larger in general. Therefore, if a predictable user does something unusual one day, the error for that day will spike, and be easily spotted as an outlier. Meanwhile, for the less predictable user, it takes a more unusual day to be highlighted as an outlier.
In practice, using this function, and some apply commands in R, we can quickly run all users through the model, each time pulling outlying days from the error component where they are more than N standard deviations from the mean, or (as for box plots) where they are more than 1.5 times the interquartile range from the upper or lower quartiles.
In practice, this is fairly straightforward to implement, a good starting point is found in this stackoverflow post.
There are no published comments.
New comment